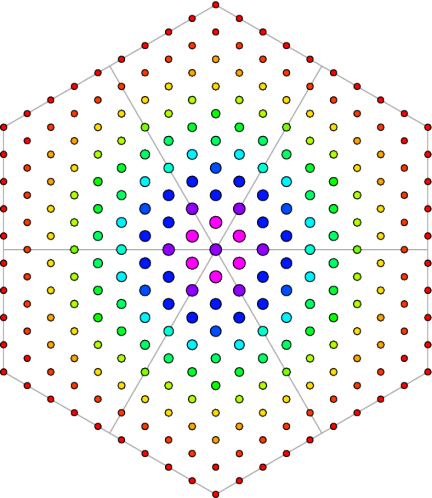
Figure 10: (color version)
Mean locations, all profiles for 9 voters. The color of a node indicates the number of profiles sharing that location. Red indicates there is a unique profile whose mean is at that location, yellow indicates 4–5 profiles . . . and magenta indicates 22–24 profiles with mean at that node. Multiplicity increases towards the center, and the multiplicity of the central node is 22, with six magenta points of multiplicity 24 surrounding it.

Leave a Comment